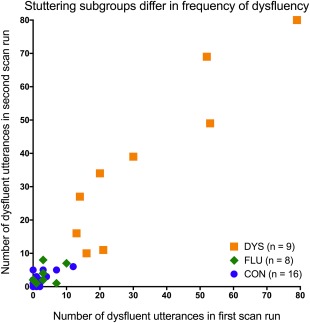
Figure 2.

Stuttering subgroups differed in terms of the frequency of dysfluent utterances during scan runs. This plot reflects how we determined subgroups of people who stutter using a data‐driven threshold of 10 dysfluent utterances per scan run. The mostly fluent (FLU) subgroup overlapped entirely with the fluent control group (CON) in their frequencies of dysfluent speech in the scanner. The somewhat dysfluent stuttering subgroup (DYS) did not overlap with either CON or FLU in terms of the number of dysfluent utterances across scan runs [Color figure can be viewed at http://wileyonlinelibrary.com]
