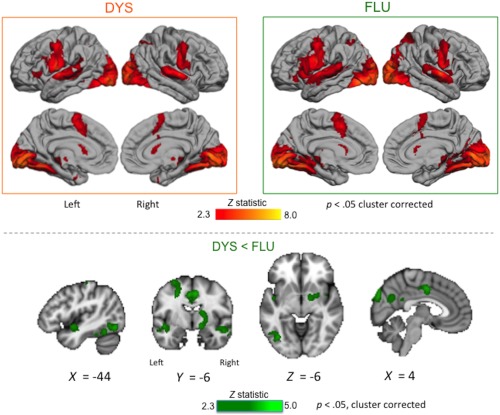
Figure 5.

Within‐trait effects related to stuttering subgroups. Averaged brain activity across both speech tasks is shown for the DYS and FLU subgroups (boxed images, top; see legend to Figure 3 for details). Areas with reduced activity in DYS relative to FLU subgroups across tasks are shown in green overlaid on sections through the MNI‐152 average brain (bottom; Z > 2.3, p < .05, corrected; coordinates in MNI space). These differences were observed in subcortical grey matter, cingulate cortex, left inferior temporo‐occipital cortex, superior temporal cortex bilaterally, and medial parieto‐occipital cortex. There were no areas where activity was greater in the DYS relative to the FLU subgroup [Color figure can be viewed at http://wileyonlinelibrary.com]
