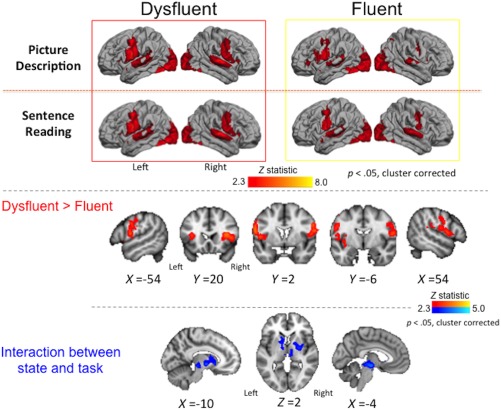
Figure 6.

State effects. Averaged brain activity during each speech state (dysfluent and fluent) is shown for the picture description and sentence reading tasks separately (boxed images, top, see legend to Figure 3 for details). Areas showing greater activity during dysfluent relative to fluent states within individuals across tasks are shown in red (middle; see legend to Figure 5 for details). Individuals had greater activity during dysfluent relative to fluent speech in the lateral inferior frontal and premotor cortex extending into the opercular cortex and anterior insula bilaterally. Subcortical areas showing a significant interaction between state and task are shown in blue (bottom; see legend to Figure 5 for details) [Color figure can be viewed at http://wileyonlinelibrary.com]
