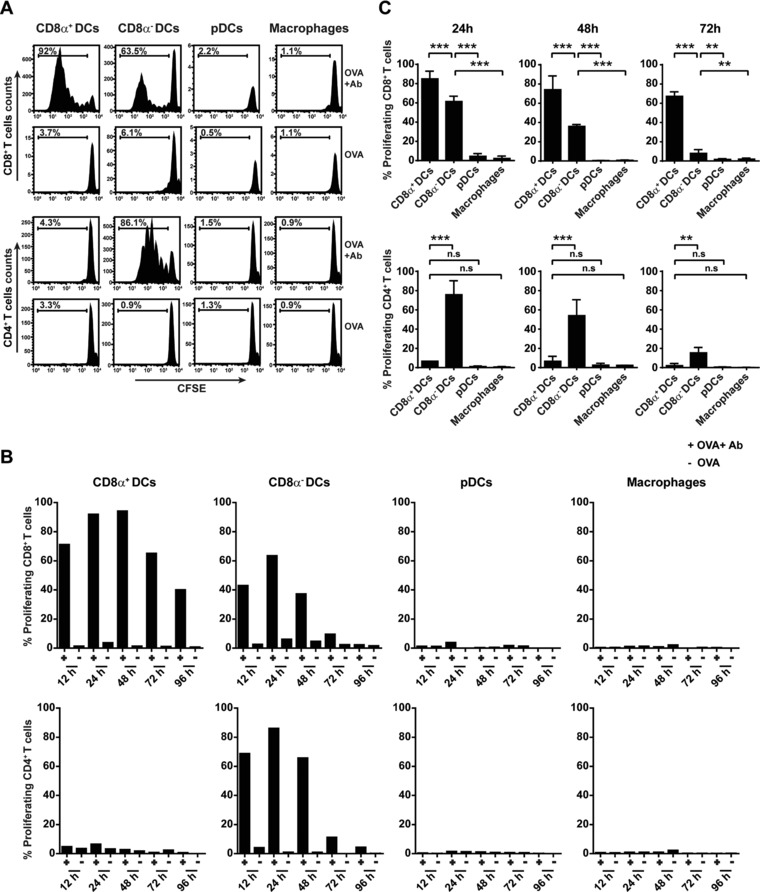
Figure 5.

Sustained and selective antigen presentation by splenic CD8α+ and CD8α− DCs. BL/6 mice (two mice per group) were injected with Ab followed by OVA i.v. injection 30 min later. At different time points (12 h/24 h/48 h/72 h and 96 h), splenic APC subsets were isolated of individual mice by FACS sorting according to the markers described in Fig. 3A and incubated with CFSE‐labeled OTI (CD8+/ CD90.1+) or OTII (CD4+/ CD45.1+) cells ex vivo for 3 days. CD8+ T‐cell and CD4+ T‐cell proliferation by APC subsets was measured in mice that received OVA and Ab or only OVA for 24 h, indicated by the percentage of divided T cells (A). Percentage of CD8+ T‐cell and CD4+ T‐cell proliferation activated by APC subsets at all time points is shown from one representative experiment out of three performed (B). Average proliferation data of three independent experiments showing MHCI cross‐presentation (upper panel) and MHCII antigen presentation (lower panel) by each APC subset after 24, 48 and 72 h (C). **p < 0.01, ***p <0.001, n.s: non‐significant.
