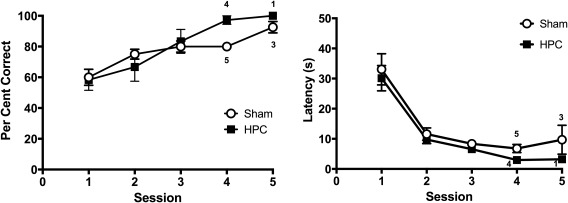
Figure 5.

The mean percentages correct choice (left‐hand panel) and the mean latencies to reach a goal location (right‐hand panel) across training sessions in Experiment 2. Note that following Session 3, decreasing number of animals are included in the data plot as animals reached the learning criterion at different points during training, as indicated by the number on each plot. Error bars represent ± SEM
