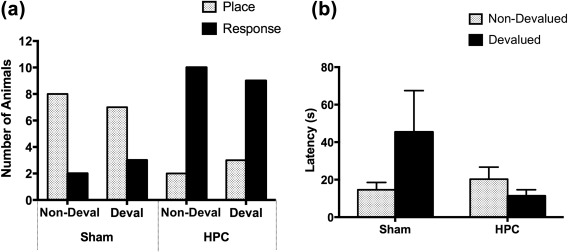
Figure 6.

(a) The number of rats that displayed the place strategy (gray bars) and the response strategy (black bars) in probe trials following the prefeeding of the maintenance diet (Non‐Deval) and following the prefeeding of the instrumental reinforcers (Deval) in Experiment 2. (b) The mean latencies to reach one of the goal locations during the non‐devalued and devalued probe trials in Experiment 2. Error bars represent ± SEM
