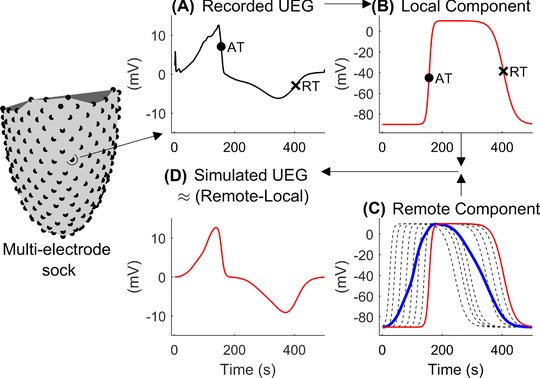
Figure 1.

Schematic representation of the model. UEG were recorded using a multielectrode sock measuring 240 UEGs. A, Activation (AT, circle) and repolarization times (RT, cross) were measured from the unipolar electrogram (UEG). B, For each cardiac site, a local action potential (red line) was generated by adjusting a stylized action potential to fit AT and RT measured in vivo. C, The position‐independent component (blue bold line) representing remote activity was computed as the mean of all APs (only a representative subset of the local APs is shown dashed black lines). D, The simulated UEGs, generated as a rescaled difference between the remote and local components, shows similar morphology as the corresponding recorded one shown in panel A [Color figure can be viewed at http://wileyonlinelibrary.com]
