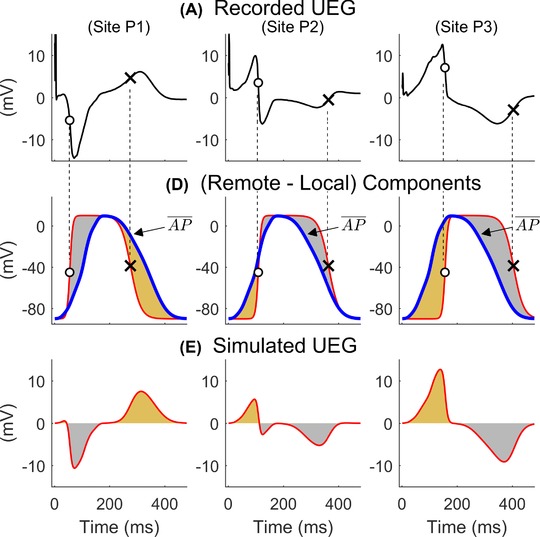
Figure 2.

Top: UEGs recorded in one patient at sites P1–P3 showing different morphologies. Middle: Local (bold line) and remote position‐independent (blue bold line) components from the simple model. Bottom: Simulated UEGs generated as a rescaled difference between the remote and local components are similar to the recorded one (top panels). From left to right, a UEG shows QS‐, RS‐, or R‐waves when the local component precedes, intersects, or follows the remote one, respectively. Similarly, a UEG shows a positive, biphasic, or negative T‐wave when the local component precedes, intersects, or follows the remote one, respectively. The occurrence of QRS complexes and T‐waves with different morphologies depends on activation and repolarization sequences, respectively, and any combination is possible. Figures adapted from (7) [Color figure can be viewed at http://wileyonlinelibrary.com]
