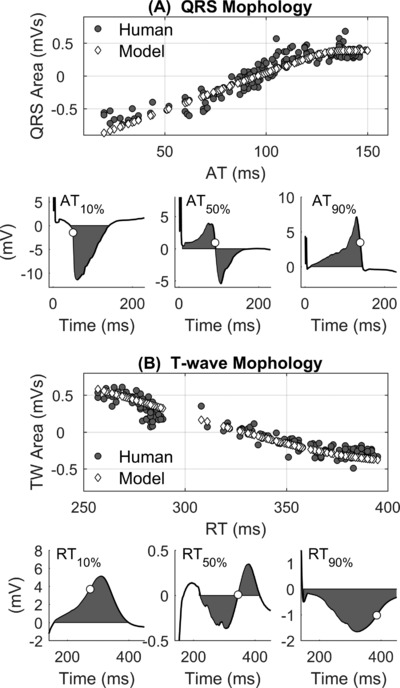
Figure 5.

Spatial interaction between activation/repolarization dynamics and the morphology of the unipolar electrograms. A, Strong positive correlation between the area under the QRS complex of the local unipolar electrogram (UEG) and local activation (AT) measured at the same site. Gray circles and white diamonds indicate results from recorded and simulated UEGs, respectively. Bottom: examples of QRS complexes from recorded UEGs corresponding to AT equal to the 10th, 50th, and 90th percentile (white circles). B, Strong negative correlation between the area under the T‐wave of the local unipolar electrogram (UEG) and local repolarization time (RT) measured at the same site. Gray circles and white diamonds indicate results from recorded and simulated UEGs, respectively. Bottom: examples of T waves from recorded UEGs corresponding to RT equal to the 10th, 50th, and 90th percentile (white circles)
