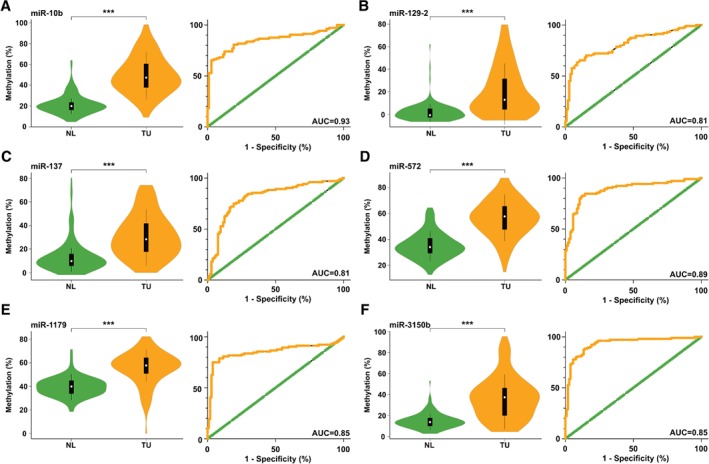
Figure 2.

MS‐HRM analyses of the (A) miR‐10b, (B) miR‐129‐2, (C) miR‐137, (D) miR‐572, (E) miR‐1179 and (F) miR‐3150b genes in TU samples and NL samples from 104 NSCLC patients. Statistically significant differences in miRNA methylation between TU samples and NL samples were found, and are summarized by violin plots. In addition, ROC curves demonstrating the discrimination between TU samples and NL samples of 104 NSCLC patients on the basis of miRNA methylation are shown. ***p < 0.0001.
