Figure 5.

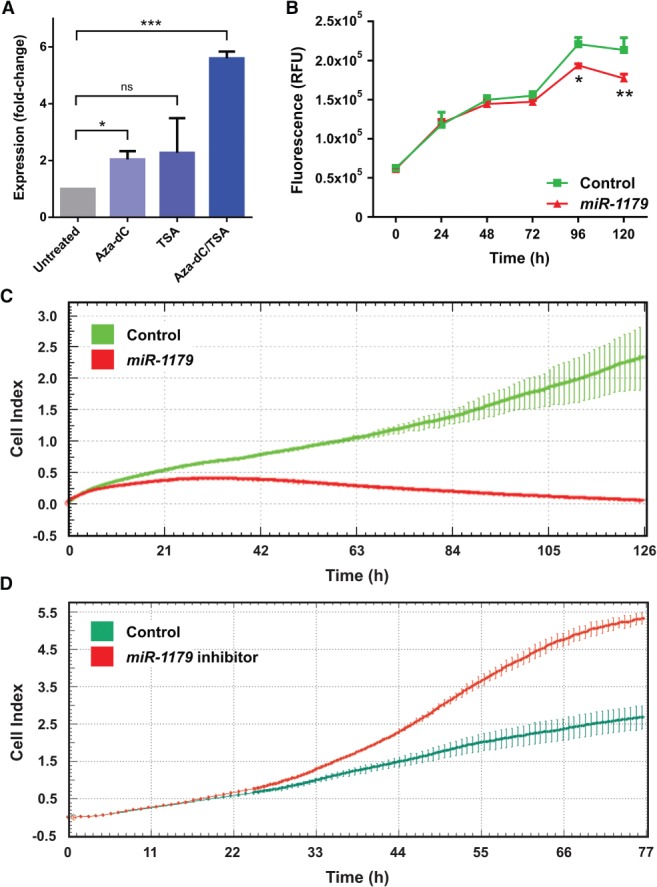
Effect of epigenetically active drugs on miR‐1179 gene expression and of miR‐1179 transfection on cell viability/proliferation of NSCLC cells. (A) A549 cells were treated with either Aza‐dC, TSA, or a combination of Aza‐dC and TSA. miR‐1179 gene expression was found to be upregulated in drug‐treated cells, as determined by RT‐PCR. The fold change in expression of drug‐treated cells as compared with untreated cells is shown. *p < 0.05; ***p < 0.001; ns, not significant. (B) Reduced viability of miR‐1179 mimic‐transfected NCI‐H2073 cells as compared with control cells was observed. Experiments were performed in triplicate. Error bars indicate standard deviations. RFU, relative fluorescence units; *p < 0.05; **p < 0.01. (C) Reduced proliferation of miR‐1179 mimic‐transfected NCI‐H2073 cells as compared with controls was found with the xCELLigence RTCA system. Cells were plated in triplicate. Error bars indicate standard deviations. (D) Increased proliferation of stably miR‐1179‐transfected A549 cells treated with miR‐1179 inhibitors as compared with controls was found with the xCELLigence RTCA system. Cells were plated in triplicate. Error bars indicate standard deviations. Cell index, quantitative measure of cell number.
