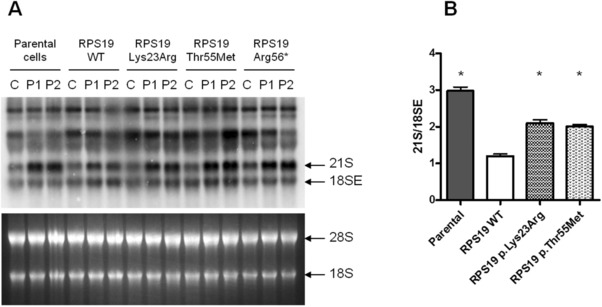
Figure 3.

Complementation assay on VUS found in population databases. A: Representative Northern blot experiment. Upper panel shows Northern blot, lower panel shows the corresponding RNA gel stained by a fluorescent nucleic acid dye. C: control, P1: patient 1, P2: patient 2. B: Densitometry quantification of 21S/18SE ratio shows that neither variant could rescue the defective rRNA processing in patients cells. Asterisks represent statistically significant differences (P < 0.05) between samples with wild‐type and mutant exogenous RPS19. Error bars represent standard error of the mean
