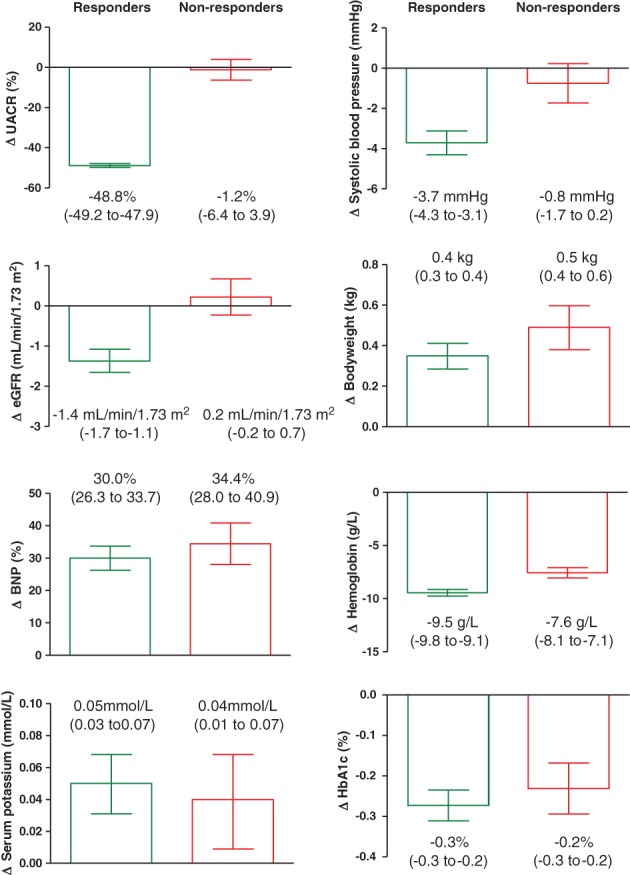
Figure 1.

Changes in renal risk markers after 6 weeks of treatment with atrasentan. Data are presented as mean (95% CI). Numbers below each bar indicate mean (95% CI) change. Although numerical differences were small, due to the large samples, size differences between responders and non‐responders reached statistical significance (P ≤ .05) in all parameters except BNP, potassium, and Hba1c
