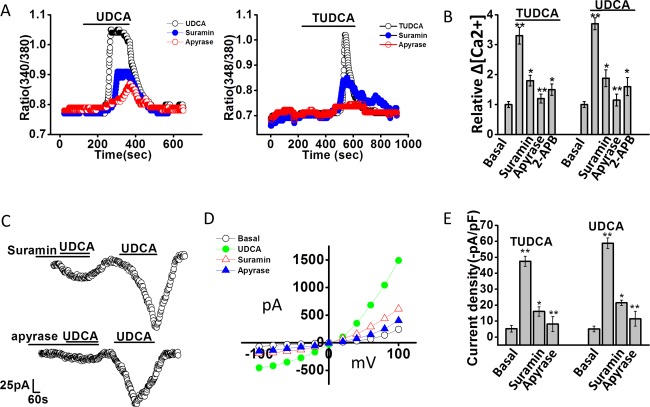
Figure 3.

Bile‐acid–stimulated increases in [Ca2+]i and Cl– currents are dependent on extracellular ATP‐mediated P2 receptor stimulation. (A) Representative studies of MLC cells demonstrating increases in [Ca2+]i, in response to UDCA (2.5 mM, left panel) and TUDCA (2.5 mM, right panel) in the absence or presence of the P2 receptor antagonist, suramin (‐•‐,10 μM, closed blue circle), or the ATP hydrolyzing enzyme, apyrase (‐ο‐, 5 U/mL, open red circle). (B) Cumulative data demonstrating the change in [Ca2+]i in response to bile acids in control cells (n = 178) and in the presence of suramin (n = 62), apyrase (n = 52), or the IP3 receptor inhibitor, 2‐APB (n = 35). Values represent relative change in fluorescence ratio 340/380. **Maximal increase versus basal P ≤ 0.01; *inhibitor versus control P ≤ 0.05; **apyrase versus control P ≤ 0.01. (C). Representative whole‐cell patch‐clamp recordings in response to UDCA in the presence of suramin (10 μM, left panel) or apyrase (5 U/mL, right panel) as indicated by the bars. In each case, currents activated after the inhibitor was removed from the bath solution. (D) I‐V plots, generated from step protocol, showing Cl– currents under basal (ο), UDCA (•, closed green circle), UDCA with suramin (Δ, open red triangle), or UDCA with apyrase (▴, closed blue triangle) conditions. (E) Cumulative data representing maximum current density (‐pA/pF) measured at –40 mV in response to TUDCA or UDCA. ** P ≤ 0.01 maximum current density versus basal. *Suramin (n = 6; P ≤ 0.05) and **apyrase (n = 9; P ≤ 0.01) significantly inhibited bile‐acid–stimulated currents.
