Figure 6.

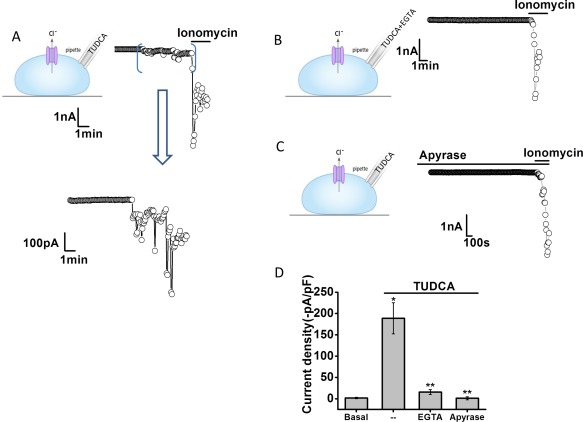
Intracellular dialysis with TUDCA activates Cl– currents. Representative whole‐cell currents recorded during intracellular dialysis with TUDCA (100 μM) by inclusion in the patch pipette (A). Currents measured at –40 mV (○), representing ICl– are shown. Horizontal bar above the trace indicates application of the Ca2+ ionophore, ionomycin (1 μM). Area between brackets is shown in expanded view (bottom). Representative traces with inclusion of EGTA (10 mM/L) in pipette (B) and in the presence of the ATP hydrolyzing enzyme apyrase (5 U/mL) in the bath solution (C). (D) Cumulative data showing the magnitude of TUDCA‐stimulated currents, reported as current density (‐pA/pF) under control conditions and with intracellular Ca2+ chelation (EGTA in pipette) or apyrase in the bath solution. **Intracellular delivery of TUDCA significantly increases currents (n = 13; P < 0.05). *Currents were inhibited by EGTA (n = 9, P < 0.01) or apyrase (n = 10, P < 0.01).
