Figure 1.

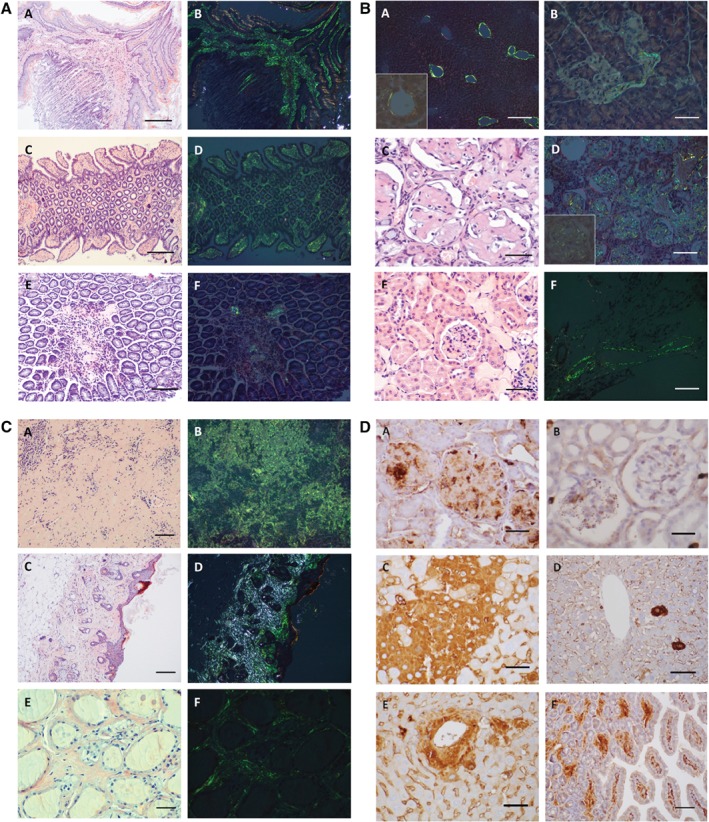
Representative photomicrographs of amyloid deposits in tissues from PACAP KO mice and of Apo‐AIV immunoreactivity in aged WT and PACAP KO mice. (Part A) Amyloid deposits in esophagus (A, B) and small intestine of a 16‐month‐old PACAP KO mouse (C, D), and WT of the same age (E, F). Congo red staining without polarizing light (A, C, E) showing red homogeneous amyloid deposits confirmed in the same locations of the same sections with polarizing light displaying apple‐green birefringence (B, D, F). Scale bar = 200 μm (A, B) or 170 μm (C–F). (Part B) Amyloid deposits in liver (A), pancreas (B), kidney (C, D), and a vein in adipose tissue (F) of a 16‐month‐old PACAP KO mouse and in the kidney of WT of the same age (E). Congo red staining without polarizing light (C, E) showing red homogeneous amyloid deposits, and apple‐green birefringence under polarizing light (A, B, D, F). Insets (A, D) show an enlarged area of a central vein in the liver (A) and a renal glomerulus (D). Scale bar = 350 μm (A), 80 μm (B, E), 30 μm (C), 100 μm (D), or 200 μm (F). (Part C) Amyloid deposits in spleen (A, B), skin (C, D), and thyroid gland (E, F) of a 16‐month‐old PACAP KO mouse. Congo red staining without polarizing light (A, C, E) showing red homogeneous deposits confirmed in the same sections with polarizing light displaying apple‐green birefringence (B, D, F). Scale bar = 250 μm (A–D) or 80 μm (E, F). (Part D) Apo‐AIV immunoreactivity in kidney glomeruli of aging KO (A) and aging WT (B), in degenerated hepatocytes in patches of an aging KO (C), and in single hepatocytes in an aging WT mouse (D) and around the central vein in an aging KO animal (E). Intestinal villi displaying immunoreactivity in an aging KO mouse (F). Scale bar = 30 μm (A, B), 70 μm (C–E) or 150 μm (F).
