
Figure 2.
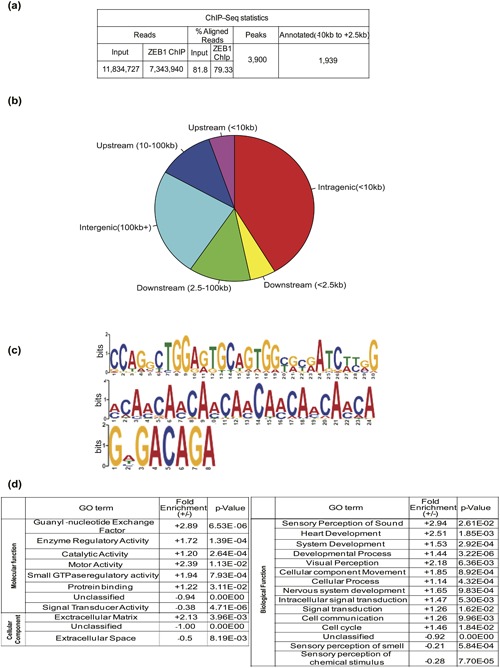
Genome–wide ZEB1 association in triple–negative breast cancer cells. (a) Table showing data and flow of analysis of the ChIP–Seq experiment from sequence reads to annotated gene assignment of the ZEB1 binding sites. (b) Pie chart showing the relative location of ZEB1 binding peaks on the Hg19 genome with respect to genes. (c) Visualization of statistically significant and centrally enriched DNA motifs, derived from the ZEB1 binding site sequences in Hs578T cells using the TOMTOM motif comparison tool. Sequence position is graphed on the x‐axis versus probability of frequency (bits) on the y‐axis. (d) Gene ontology (GO) analysis of annotated genes from the ZEB1 ChIP–Seq peaks into molecular function, biological process and cellular component categories using the GO Panther database. Relative fold‐enrichment and p‐values indicate significance of each functional category