
Figure 3.
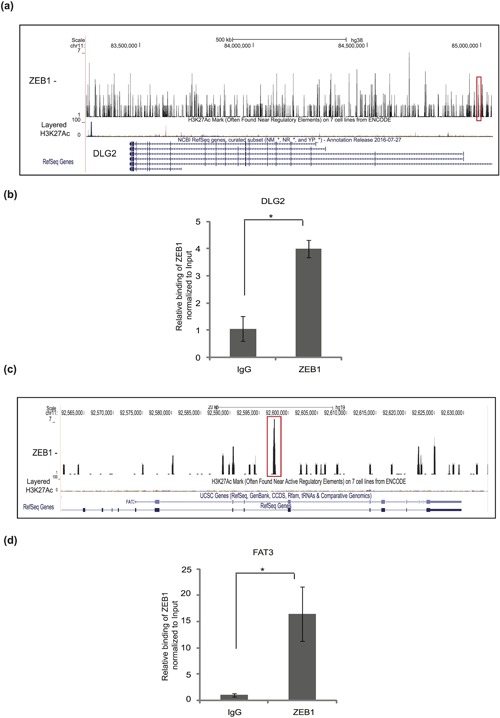
Novel gene targets of ZEB1 in breast cancer cells. (a–c) Representation of ZEB1 binding to the DLG2 (a) and FAT3 (c) genes; ChIP–Seq peaks (marked in red box) were aligned with tracks of H3K27Ac ChIP–Seq, which is used as a marker of gene activity, based on data available on the database, using the UCSC genome browser. (b–d) ChIP‐qPCR showing the significant enrichment of the DLG2 (b) and FAT3 (d) promoter regions in a ChIP experiment using the ZEB1 antibody, relative to the enrichment by non‐specific IgG. Statistical significance p‐value <0.002; n = 3