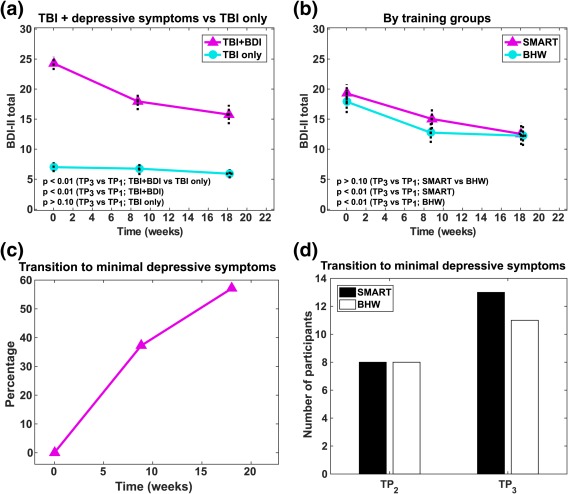
Figure 1.

Temporal changes in depressive symptoms severity. (a) Changes according to the presence of depressive symptoms. (b) Changes according to the types of intervention program. (c) Percentage of participants with resolved depressive symptoms following intervention. (d) The number of participants with resolved depressive symptoms following training, according to the types of intervention program. BDI–II, Beck Depression Inventory‐Second Edition; TBI + BDI, TBI‐plus‐depressive symptoms group (BDI–II of 14–63 prior to intervention); TBI only, TBI with minimal depressive symptoms group (BDI–II of 0–13 prior to intervention) [Color figure can be viewed at http://wileyonlinelibrary.com]
