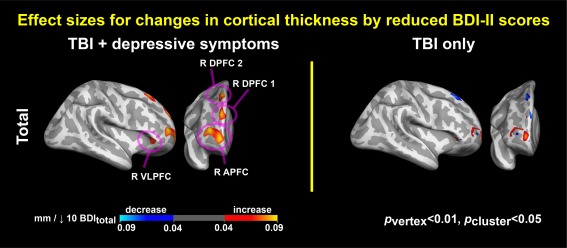
Figure 5.

Effect sizes for associations between changes in cortical thickness and reductions in depressive symptoms. Colormaps represent increases or decreases in cortical thickness per reductions in BDI–II total scores by 10. R = right; VLPFC = ventrolateral prefrontal cortex; APFC = anterior prefrontal cortex; DPFC = dorsal prefrontal cortex [Color figure can be viewed at http://wileyonlinelibrary.com]
