
Figure 2.
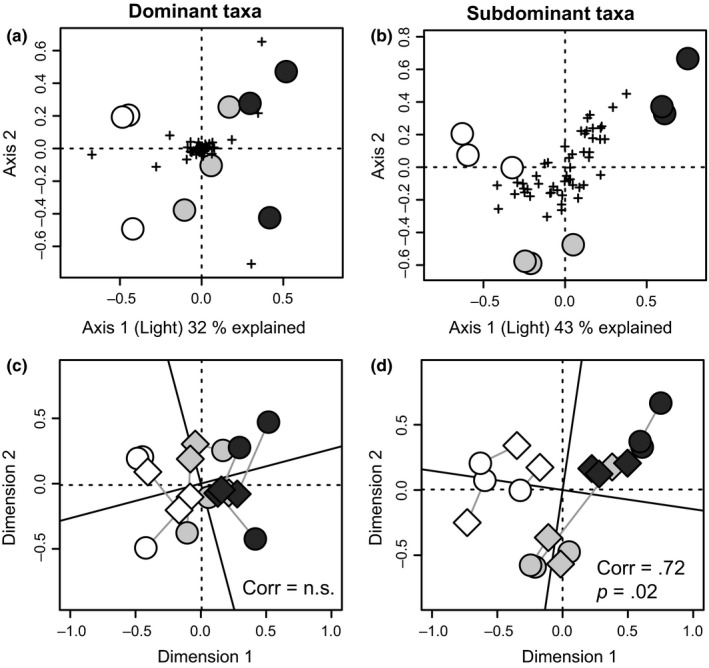
The response of dominant and subdominant taxa to varying light availability. The RDA ordinations display variability in sample composition of dominant (a,c) and subdominant (b,d) genus‐level taxa (based on rRNA abundance). Ordinations were constrained to light (measured light intensity), which varies along the x‐axis. Circles represent samples, and crosses represent taxa (a–b). In c–d, the taxa‐based ordinations (circles) have been correlated to an ordination of functional mRNA categories (SEED Subsystems level 2) of the same samples (diamonds) using Procrustes rotation. Grey lines connect taxa (rRNA)‐based and mRNA‐based points from the same sample. Correlation statistics are indicated in the plots. Shading of the plotting points indicates light treatment (darker shade = lower light intensity). Dominant taxa are the top 50 most abundant genus‐level taxa in the data set, while subdominant taxa were defined as the 51st to 100th most abundant taxa