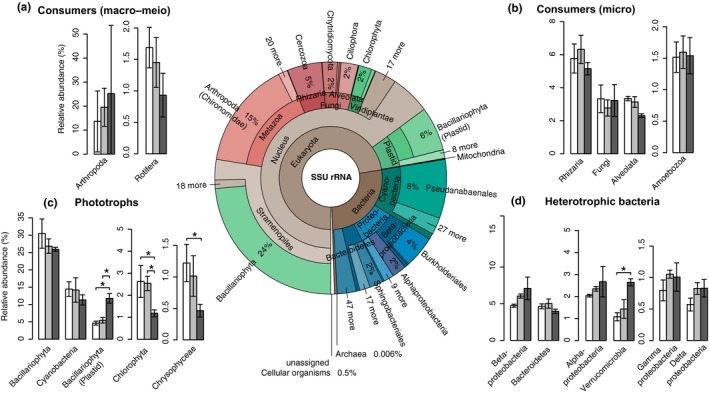
Figure 3.

The relative abundances of the main biofilm taxa on a broad taxonomic level. The Krona chart (centre) displays overall relative abundance of SSU rRNA‐derived sequencing reads of all samples (n = 9). Taxa are coloured according to functional group: Phototrophs = greens, consumers = reds and heterotrophic bacteria = blues (brown shades indicate higher‐level taxa encompassing several functional groups). The bar plots (a–d) display relative abundances of specific taxa in response to the different light conditions (normalized to assigned SSU reads per sample and expressed as a percentage). Taxa are displayed according to major functional groups: Consumers (a: macro–meio consumers, b: microconsumers), phototrophic taxa (c) and heterotrophic bacteria (d). Bars are shaded to indicate the light condition (darker shade = lower light intensity). Error bars refer to standard deviation of the mean (n = 3), and significant differences between the light treatments are indicated with asterisks (*p < .05) according to taxa‐wise negative binomial GLMs with Benjamini–Hochberg correction for multiple testing (as implemented in edger)
