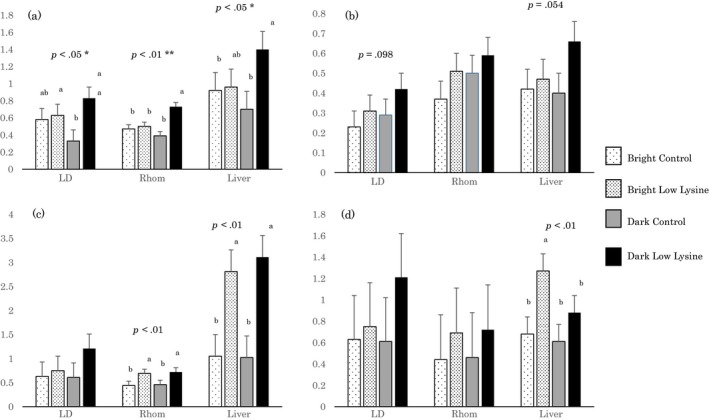
Figure 1.

Abundance of messenger RNA (mRNA) of insulin receptor (a), insulin receptor substrate 1 (b), acetyl CoA carboxylase (c), and fatty acid synthase (d) in Longissimus dorsi and Rhomboideus muscles and liver. Bars are expressed as least square means and error bars are their pooled standard errors, n = 4. The abundances are expressed as relative ratios of the target mRNAs to the internal standard mRNA (18S ribosomal RNA). LD; longissimus dorsi muscle, Rhom; rhomboideus muscle. p values are the results of analysis of variance on the effects of dietary lysine levels. * and **, the interactions between lighting conditions and dietary lysine levels are significant, p < .05 and p < .01, respectively. a and b, differences between least square means (p < .05)
