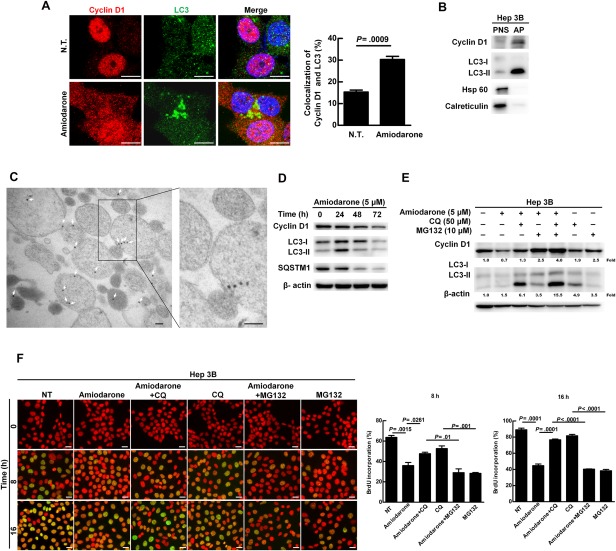
Figure 3.

Increased autophagy caused cyclin D1 degradation and the existence of cyclin D1 in the AP. (A) Hep 3B cells were treated with or without amiodarone (5 μM) for 24 hours. The representative confocal images show cyclin D1 and LC3 protein. Scale bar = 10 μm. Quantification of colocalization of cyclin D1 and LC3 was conducted by randomly counting 30 cells. The data represent means ± SEM. (B) Hep 3B cells were treated with amiodarone (5 μM) for 24 hours followed by CQ (50 μM) treatment for another 24 hours. The proteins in the PNS and AP were analyzed by immunoblotting for the expression levels of cyclin D1, LC3, Hsp 60 (mitochondria marker), and calreticulin (endoplasmic reticulum marker). This experiment was repeated three times. (C) Immunogold‐labeled cyclin D1 (20‐nm gold bead) in the purified double‐membrane APs was detected under TEM. Scale bar = 100 nm. (D) Hep 3B cells were treated with amiodarone (5 μM) for various times. (E) Hep 3B cells were treated with amiodarone (5 μM) for 48 hours. CQ (50 μM) and MG132 (10 μM) were added at 24 hours after amiodarone treatment for another 24 hours. The number under the individual band represents the fold changes as compared to the control (set as 1). (F) Hep 3B cells were synchronized and DNA synthesis was measured under the same conditions as shown in Fig. 2E by amiodarone, CQ, and/or MG132 treatment for 0, 8, and 16 hours. Scale bar = 20 μm. Quantification is shown in the diagram. Data represent means ± SEM (n=5). Abbreviation: Hsp 60, heat shock protein 60.
