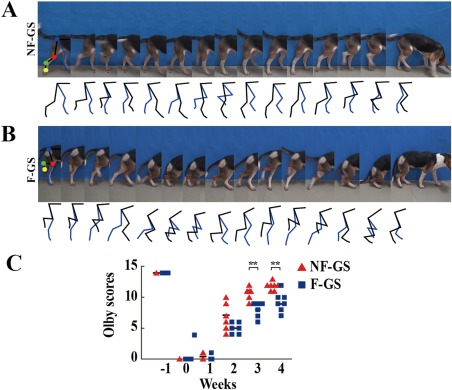
Figure 3.

Examination of hindlimb movement and assessment of Olby score. Continuous time‐lapse frames from video displayed two hindlimbs (black line representing the leg of the hemisection side of spinal cord and blue line representing the leg of the non‐hemisection side) motioning alternately, involving four major joints; hips (blue point), knees (red point), ankles (green point) and digits (yellow point), in a canine of the NF‐GS (A) and F‐GS group (B). The stepping trajectories in (A) and (B) show respectively the relative position of the four major joints during the hindlimb movement. C: Showing Olby scores in the NF‐GS and F‐GS groups. n = 7, *p < 0.05, **p < 0.01.
