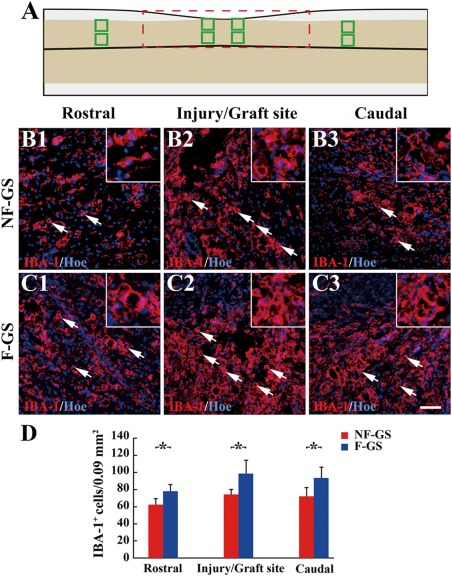
Figure 5.

IBA‐1 positive cells in spinal cord. A: A leading diagram demonstrates cell sampling sites in a longitudinal section of hemisected spinal cord. IBA‐1 positive cells (arrows) in the rostral (B1), injury/graft (B2), and caudal (B3) sites of spinal cord in the NF‐GS group. IBA‐1 positive cells (arrows) in the rostral (C1), injury/graft C2) and caudal (C3) sites in the F‐GS group. D: Bar chart showing the number of IBA‐1 positive cells in the NF‐GS and F‐GS groups. Asterisks indicate statistical significance between the NF‐GS and F‐GS groups. All nuclei of IBA‐1 positive cells were counterstained by Hoechst33342 (Hoe); n = 5, *p < 0.05. Scale bar = 50 μm in (B1–C3)
