Figure 6.

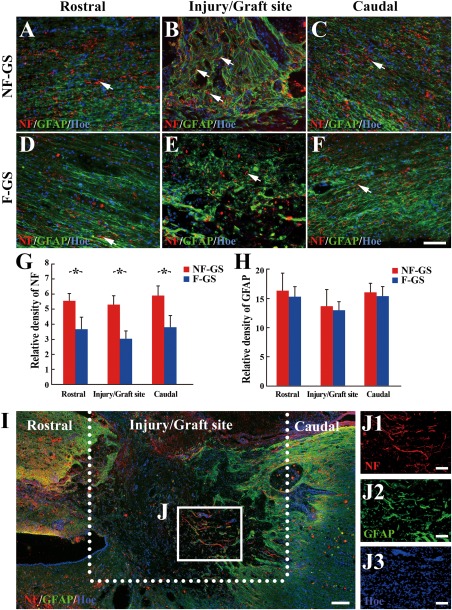
Comparison of NF positive nerve fibers and GFAP positive scars in spinal cord. NF positive nerve fibers (red, arrows) and GFAP positive scars (green) in the rostral (A), injury/graft (B), and caudal (C) sites of spinal cord in the NF‐GS group. NF positive nerve fibers (red, arrows) and GFAP positive scars (green) in the rostral (D), injury/graft (E), and caudal (F) sites in the F‐GS group. G: Bar chart shows the relative density of NF positive nerve fibers at the rostral and caudal to/in the injury/graft site of spinal cord in the NF‐GS group was higher than that in the F‐GS groups; *p < 0.05. H: Bar chart shows the relative density of GFAP positive scar at the rostral and caudal to/in the injury/graft site of spinal cord in the NF‐GS group was comparable to that in the F‐GS group; n = 7, p > 0.05. I: An overview of NF and GFAP immunofluorescence staining in a longitudinal section in the NF‐GS group. J: Note host neurons extended NF positive nerve fibers (red) from the caudal sites into the injury/graft site of spinal cord. A higher magnification of boxed area (J) in (I) displaying the overlaid image of NF, GFAP, and Hoechst33342 (Hoe)‐labeled objects, to demonstrate that host neurons can extend NF positive nerve fibers (J1, red) through GFAP positive scars (J2, green), (J3, blue). Nuclei of cells in the injury/graft site were counterstained by Hoe. Scale bars = 200 μm in (I); 100 μm in (A–F) and (J1–J3).
