Figure 2.

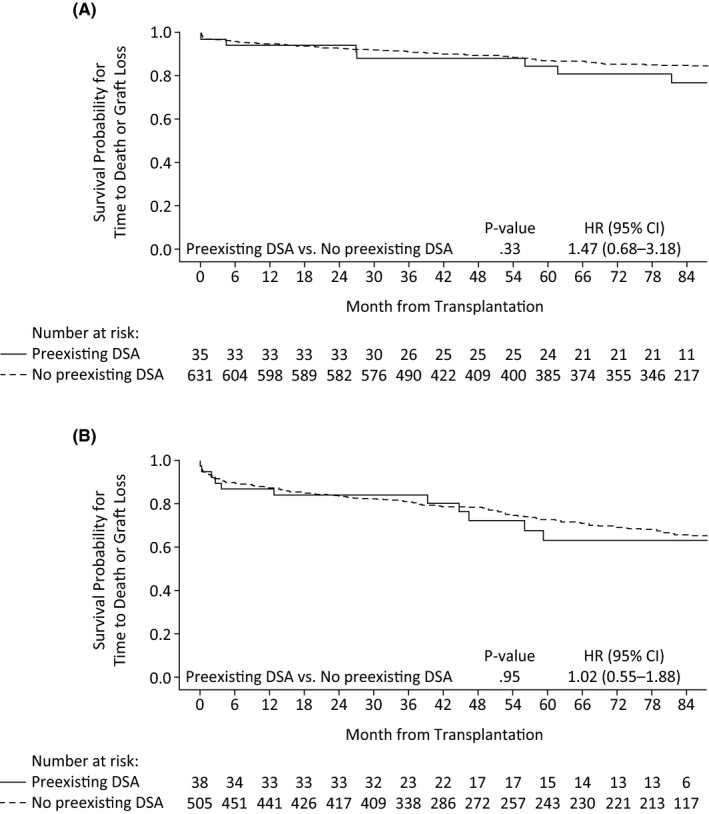
Kaplan–Meier curve for time to death or graft loss in patients with or without DSAs in (A) BENEFIT and (B) BENEFIT‐EXT. DSA, donor‐specific antibody; LI, less intense; MI, more intense

Kaplan–Meier curve for time to death or graft loss in patients with or without DSAs in (A) BENEFIT and (B) BENEFIT‐EXT. DSA, donor‐specific antibody; LI, less intense; MI, more intense