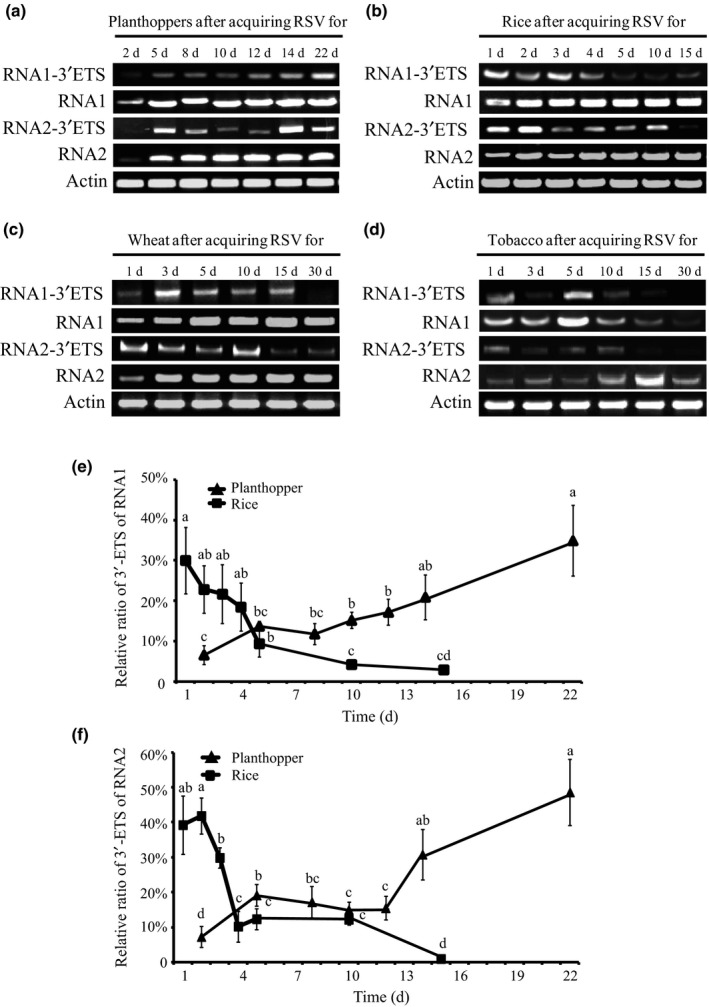
Figure 4.

Accumulation of viral extended 3′‐terminal sequences in vector insects and host plants. Accumulations of RNA1 and RNA2 with the extended 3′‐terminal sequences in the small brown planthoppers (Laodelphax striatellus) (a), rice (Oryza sativa Huangjinqing) (b), wheat (Triticum aestivum jingdong 22) (c) and tobacco (Nicotiana benthamiana) (d) at different days after RSV infection. (e, f) Charts depicting the changes in the relative ratios of RNA1 and RNA2 to the extended 3′‐terminal sequences in planthoppers and rice plants, respectively. The extended 3′‐terminal sequences (3′‐ETS) were determined by amplifying the 3′‐non‐translated regions containing the extended terminal sequences using touchdown reverse transcription–polymerase chain reaction (RT‐PCR). The total amounts of viral RNA1 and RNA2 (based on amplification of fragments from the inner regions) and the transcripts of actin were used as internal controls. The ratios of RNA1 and RNA2 to the extended 3′‐terminal sequences were determined by associating the relative grey value of 3′‐ETS to that of the RNA levels of RNA1 or RNA2 using ImageJ based on Fig. 4a,b. The values are represented as the means ± SEs. The differences were statistically evaluated by one‐way ANOVA for multiple comparisons with spss 17.0 software. Different lowercase letters indicate significant differences at the P < 0.05 level.
