
Figure 1.
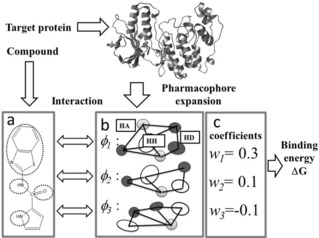
Schematic representation of the pharmacophore expansion of a ligand‐binding site of a protein. The interaction between the ligand and protein pharmacophores gives the binding energy. a: Example of pharmacophore of the ligand pharmacophore. The dotted circles represent the pharmacophore features. b: Example of pharmacophores. HH, HA, and HD indicate hydrophobic, hydrogen‐bond acceptor, and hydrogen‐bond donor sites, shown by open, grey and black circles, respectively. Only three pharmacophores (φ1, φ2, and φ3) are depicted. The lines represent the specific distances between pharmacophore features of each pharmacophore. c: Example of pharmacophore expansion of the receptor pharmacophore following eqs. 2 and 3.