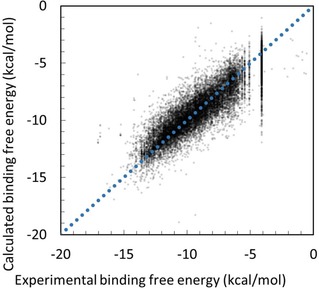
Figure 4.

Correlation between experimental and prediction data for all 107 kinase proteins obtained by the docking‐score QSAR model eliminating outliers with λ=0.005, W=20 kcal/mol, and N=0.8. The dots represent the predicted data points by the 4‐fold cross‐validation test.
