
Figure 4.
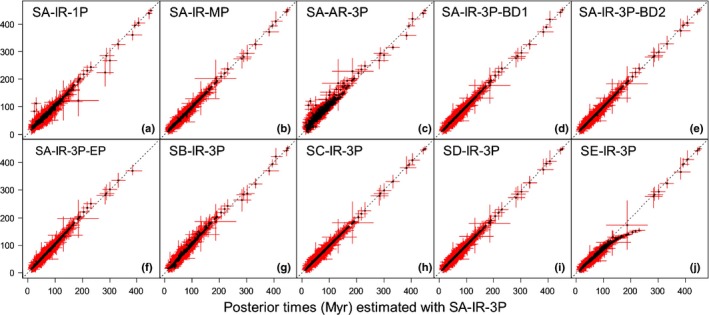
Sensitivity of time estimates to the number of partitions, rate model, birth–death process, exclusion of lycophytes + ferns and fossil calibrations. The posterior mean times (black dots) and 95% credibility intervals (CIs) (red lines) of 643 nodes under calibration strategy A (SA), independent rates (IR) model, and gene alignments and three partitions are plotted against (a) estimates using one partition, (b) mixed partitions, (c) autocorrelated rates (AR) model, (d) birth–death parameters adjusted to generate a tree with long internal branches and short tip branches (BD1), and (e) large node ages with nodes close to the root (BD2), (f) excluding ferns and lycophytes (EP), (g) calibration strategy B (SB), (h) calibration strategy C (SC), (i) calibration strategy D (SD) and (j) calibration strategy E (SE).