
Figure 6.
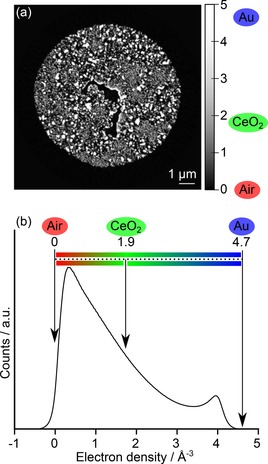
Quantitative electron density of the CeOx/np‐Au sample visualised as: (a) orthographic slice through the 3D volume with pixel values converted to electron density; (b) the corresponding histogram of the 3D volume following background removal, showing the ideal positions of pure gold, pure ceria and air. Image background was excluded from the electron density counts.