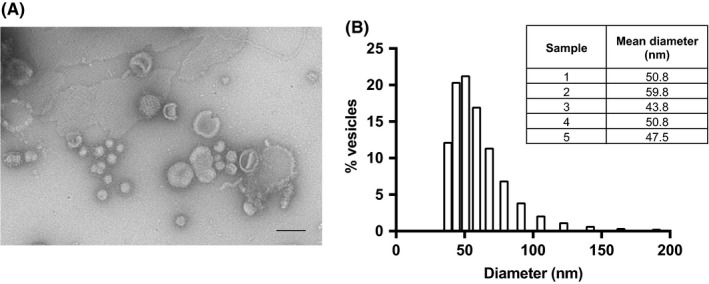
Figure 1.

Characterization of EVs isolated from T. muris ES. A, TEM analysis of vesicles isolated from T. muris ES. Scale bars denote 100 nm, and image is representative of three preparations. B, shows the size profile of a typical T. muris EV sample, as measured by DLS. Table shows mean particle diameter for several samples
