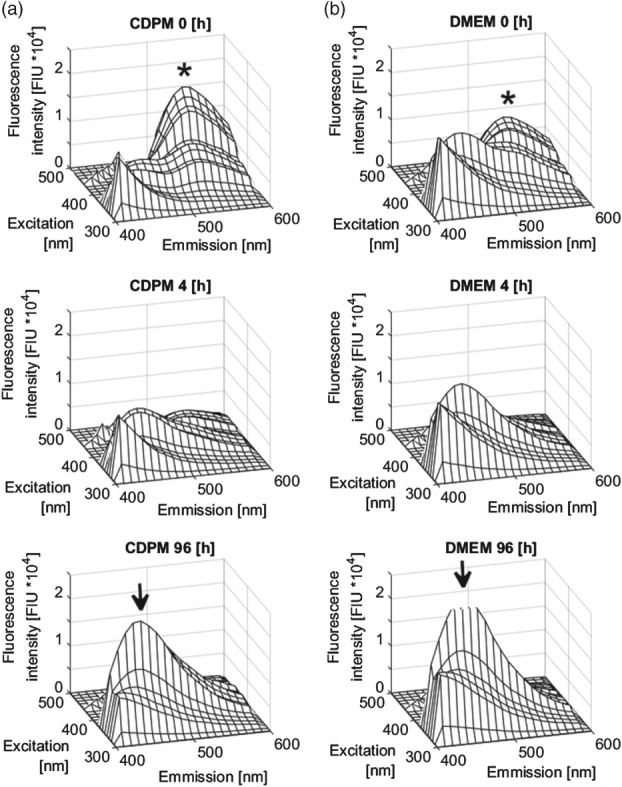
Figure 2.

Assessment of media photo‐degradation using EEM. EEM landscape plots generated from (a) CDPM and (b) DMEM after a light exposure time of 0, 4 and 96 h, respectively. In the upper and lower panels, the wavelengths bands assigned to the cluster1 and cluster2 region are marked at the point of highest intensity (cluster1: asterisks, cluster2: arrows).
