
Figure 1.
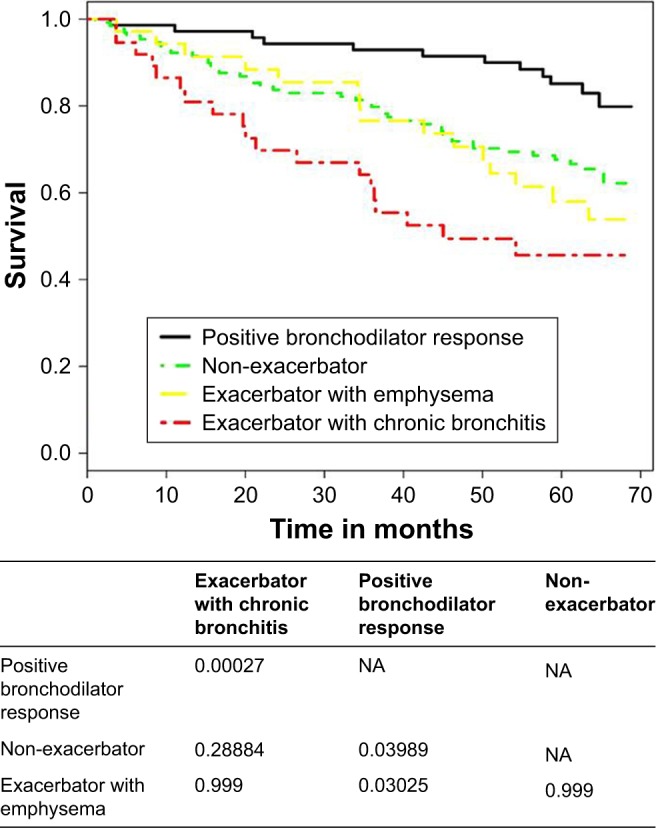
Kaplan–Meier survival curves according to the phenotype of COPD.
Note: p-value for the comparison of survival curves using the log-rank test.
Abbreviation: NA, not applicable.
Official websites use .gov
A
.gov website belongs to an official
government organization in the United States.
Secure .gov websites use HTTPS
A lock (
) or https:// means you've safely
connected to the .gov website. Share sensitive
information only on official, secure websites.
Kaplan–Meier survival curves according to the phenotype of COPD.
Note: p-value for the comparison of survival curves using the log-rank test.
Abbreviation: NA, not applicable.