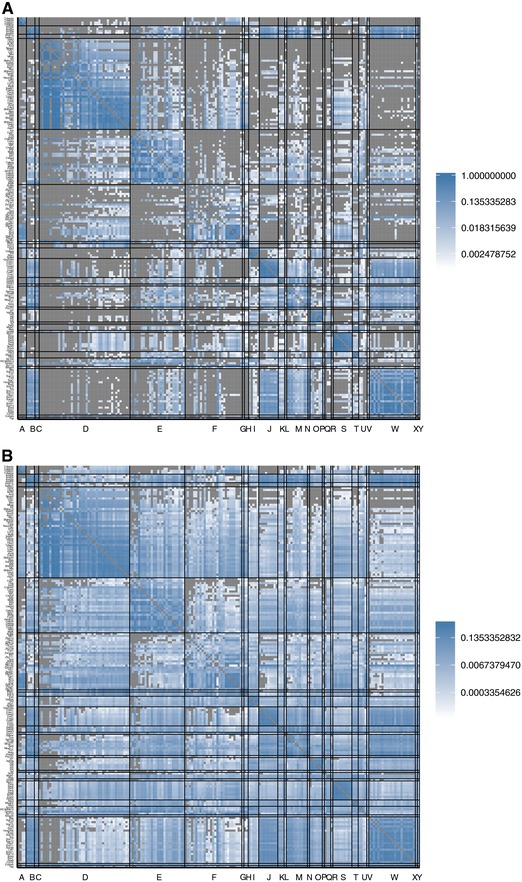
Figure 3.

Matrices of internetwork relationships for the genotype networks of TF binding sites from M. musculus. Heatmaps of log10‐transformed (A) overlap and (B) , the probability of mutating from the genotype network of phenotype p to the genotype network of phenotype q. The rows and columns are grouped according to binding domain, which are ordered alphabetically on the horizontal axis: A, AP‐2; B, ARID/BRIGHT; C, AT hook; D, bHLH; E, bZIP; F, C2H2 ZF; G, CxxC; H, E2F; I, Ets; J, Forkhead; K, GATA; L, GCM; M, Homeodomain; N, Homeodomain + POU; O, IRF; P, MADS box; Q, Myb/SANT; R, Ndt80/PhoG; S, Nuclear receptor; T, RFX; U, SAND; V, SMAD; W, Sox; X, T‐Box; Y: TBP. Within the DNA‐binding domain groups, the rows and columns are ordered by the size of each TF's dominant genotype network, such that network size increases from top to bottom and from left to right. Labels on the vertical axis indicate the name of the TFs, which can be read on the computer by zooming in. Cells colored in gray indicate either N/A values (on the diagonal) or values equal to zero (off‐diagonal).
