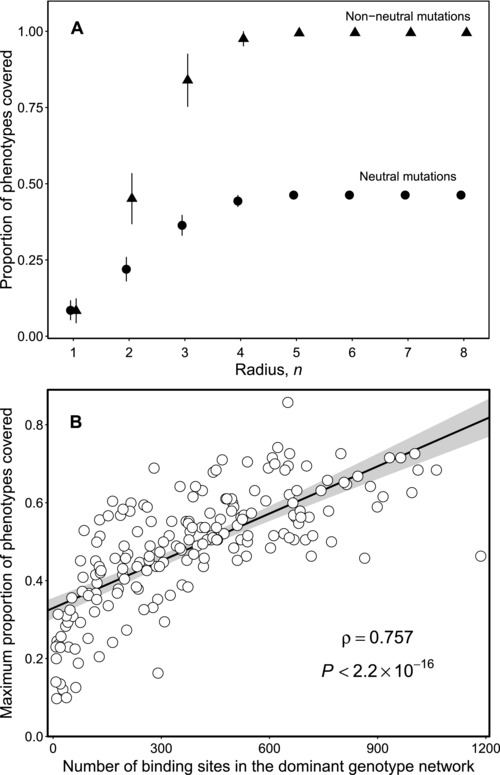
Figure 4.

Phenotype space covering. (A) The proportion of phenotypes covered as a function of the mutational radius n from a given binding site, averaged across all binding sites of the murine TF Sp110. The maximum proportion of phenotypes covered plateaus at a much lower level when considering just neutral mutations than when considering non‐neutral mutations. Error bars are the standard deviations of the mean. (B) The maximum proportion of phenotypes covered by neutral mutations as a function of the number of binding sites in the dominant genotype network, for all 190 murine TFs. The black line shows the fitted linear regression to the data () and the shaded gray area denotes 95% confidence intervals. The figure also shows the Spearman's correlation and its associated P‐value.
