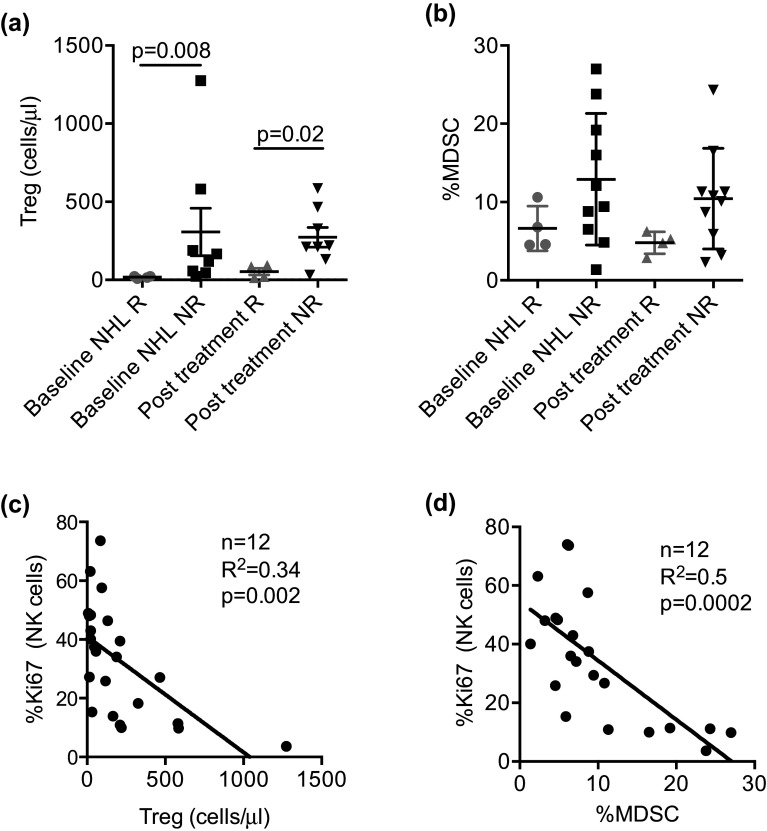
Fig. 5.
Circulating MDSC and regulatory T cell correlate with clinical response and NK cell proliferation. Circulating regulatory T cells and MDSC in NHL patients before and after therapy comparing responders (n = 4) and non-responders (n = 8–10). a, b PBMCs from NHL patients were rested overnight and stained, and then the frequencies of MDSCs and Tregs were determined by flow cytometry. Each symbol represents an individual donor. c, d Correlation analyses (n = 12) evaluating the relationship between NK cell proliferation and the numbers and frequency of Tregs and MDSCs in patients with NHL before and 14 days after treatment. Statistical analyses were done using Pearson correlation

