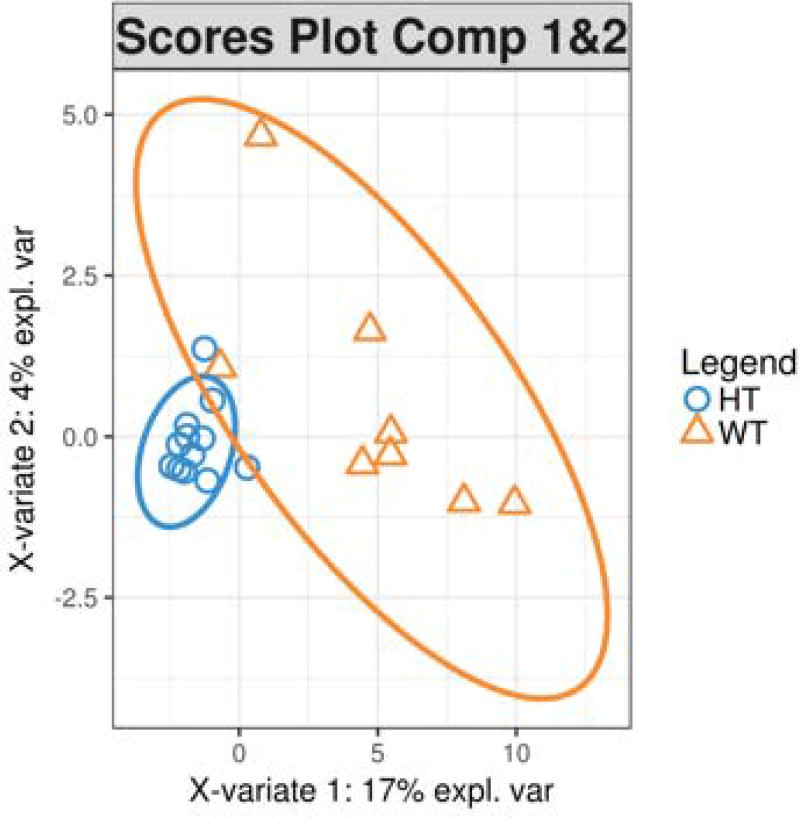
Figure 5.
Scores plot. The scores plot depicts the samples, colored according to class (genotype), projected into the space defined by the first two sPLS-DA model components. Axis labels show the level of variance explained (expl. var) by each component. sPLS-DA, sparse partial least squares discriminant analysis.

