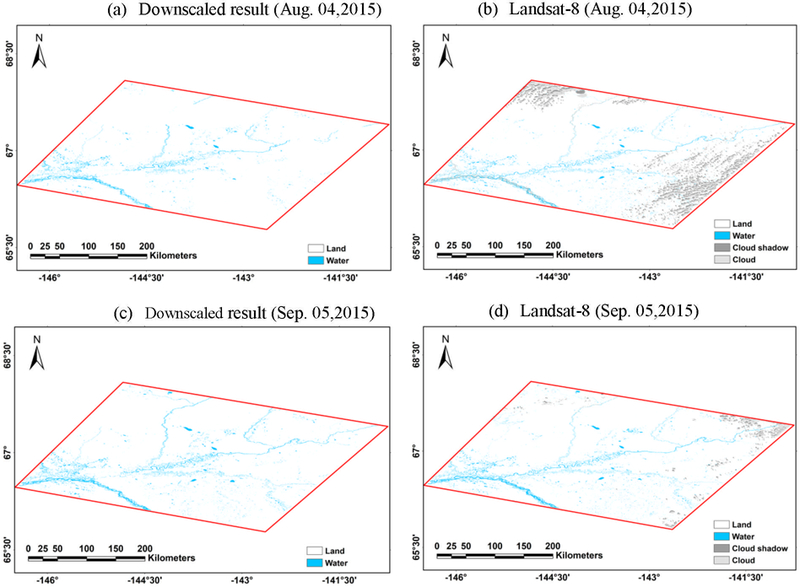
Fig.5.

SMAP downscaled results (a, c) and Landsat-8 (OLI, TIRS) (b, d) classifications of surface water (blue) and land (white) pixels for region 1 (Alaska) on Aug. 04, 2015 and Sep. 05, 2015, representing relatively dry and wet conditions. Cloud pixels in the Landsat results are marked by grey shading. SMAP classifications were based on 30-m results downscaled from the 36-km fwLBand record using the climatological Landsat-based Water Occurrence Dataset. Landsat-8 classifications were derived using the Fmask algorithm (Zhu et al., 2015).
