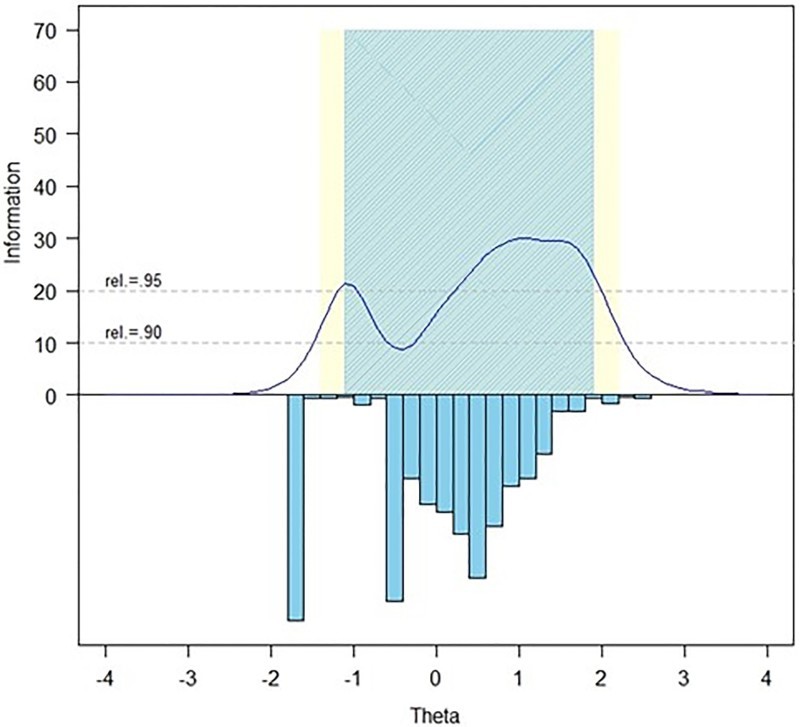
Figure 2.

Information and Precision of the SCI-QOL Pain Behavior Scale. The blue and yellow shaded regions show at what levels of the trait the item bank is highly reliable (.95 and.90, respectively). The inverted columns show the distribution of participant scores at each level of the trait.
