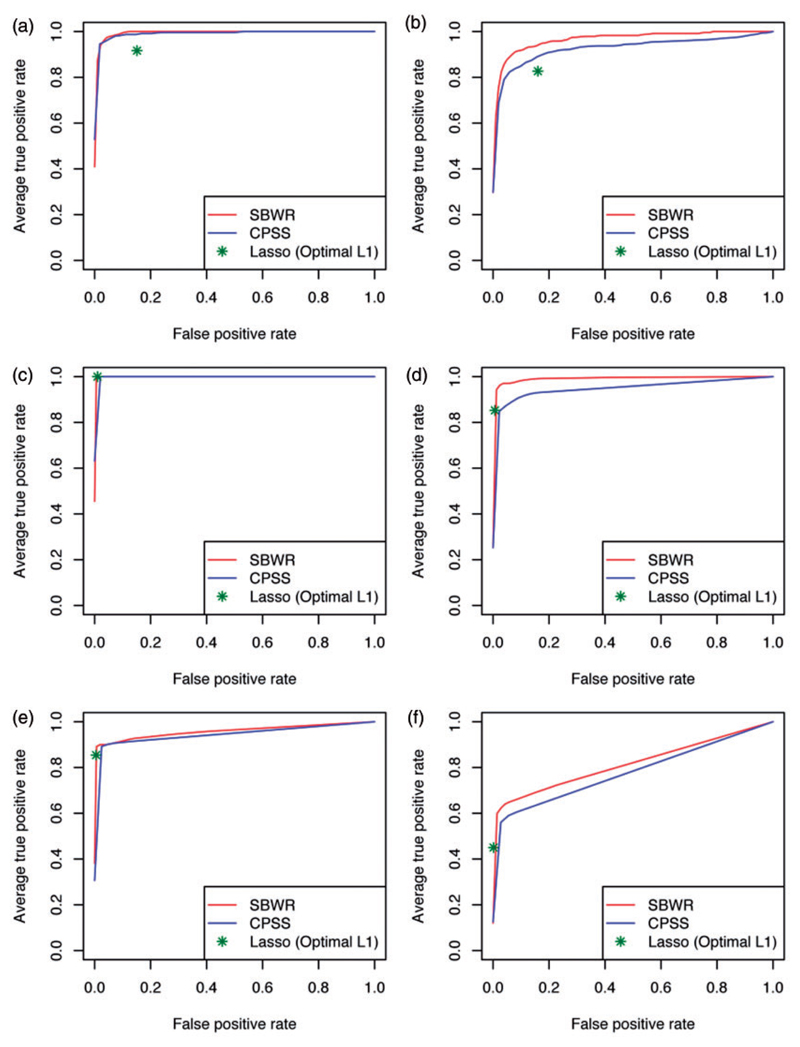
Figure 2.
ROC analysis of simulation results. Performance of association measures from CPSS and SBWR, and the LASSO selections when the penalty parameter is set to the optimum under cross-validation, in distinguishing 12 signals from noise in datasets ranging from 119 to 20,000 covariates. Panels (a), (c) and (e) show results from datasets simulated to have 12 ‘full-size’ effects, and panels (b), (d) and (f) when 12 ‘half-size’ effects were simulated. Each ROC curve is vertically averaged over the results from the analysis of 20 replicate datasets. CPSS: Complementary Pairs Stability Selection; SBWR: Sparse Bayesian Weibull Regression.

