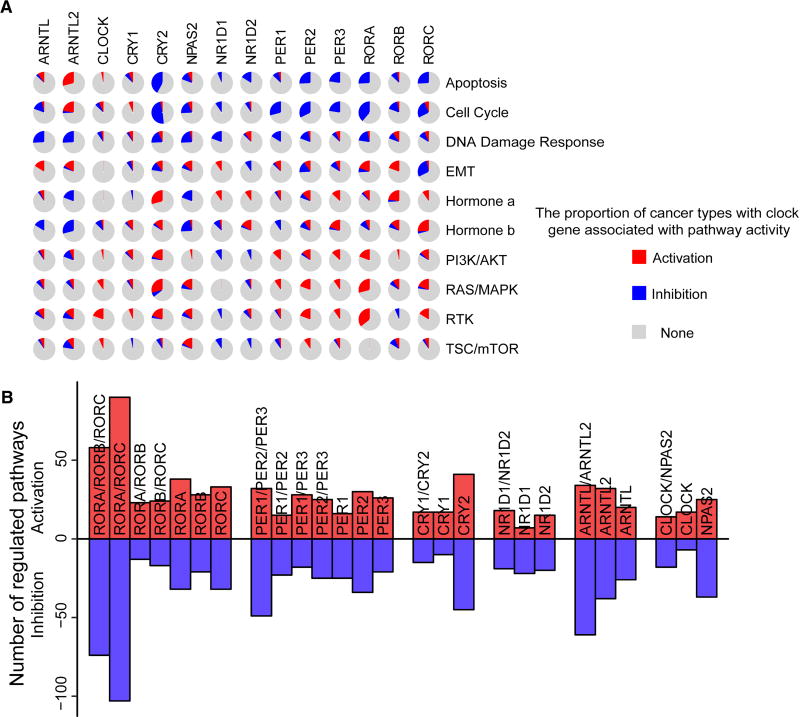
Figure 2. Functional effects of clock genes in oncogenic pathways.
(A) The proportion of cancer types with core clock genes significantly associated to activation (red) or inhibition (blue) of the ten key signaling pathways in 31 cancer types. (B) The total number of activation (red) or inhibition (blue) pathways in ten key signaling pathways across 31 cancer types, which are associated with individual or paralog clock genes. See also Figure S2.

