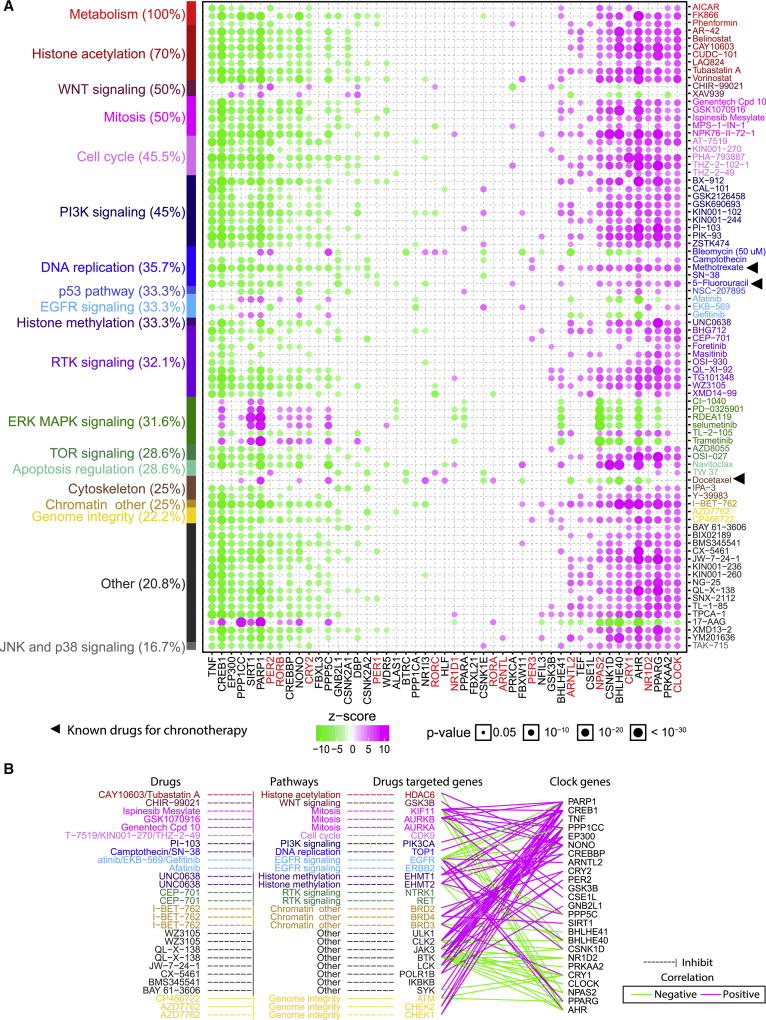
Figure 7. Drug effects of clock genes in chronotherapy.
(A) Correlation between drug sensitivity (AUCs) and gene expression of clock genes in at least 10 clock genes (green: negative correlation; magenta: positive correlation; size: p-value). Black triangles indicate compound verified in chronotherapy. Color bars in Y-axis indicate drugs (right) and their targeted pathways (left). (B) Correlation between clock genes and known drugs that target the genes (green: negative correlation; magenta: positive correlation), which corresponds to significant correlation between drug sensitivity and clock genes. See also Figure S7.

