
Figure 1. NMDA receptors in striatum are critical for learning heterogeneous action sequences.
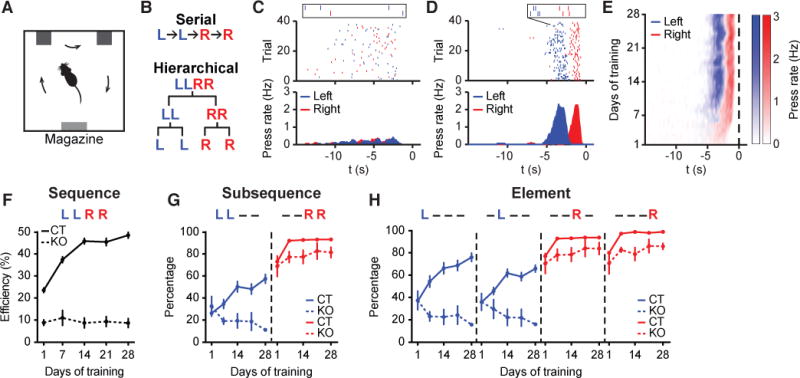
(A) Operant chamber schematic. (B) Serial (Top) vs. hierarchical (Bottom) organization of LLRR sequence. (C and D) Example of typical wildtype mouse behavior on day 1 (C) and day 28 (D) of training. Top Panels: Left and right lever presses indicated by blue and red dashes, respectively, and aligned to magazine entry at time zero. Bottom Panels: Averaged left and right lever press rate indicated by blue and red lines, respectively. Insets show two representative sequences. (E) Development of a stereotypical action sequence across 28 days of training in a wildtype mouse. (F) Behavioral efficiency for control (n = 22 mice; main effect of training F4,84 = 81.71, P < 0.0001) and striatal NR1-KO mice (n = 5 mice; no effect of training F4,16 = 0.1531, P = 0.9588) across training (main effect of genotype F1,25 = 257, P < 0.0001). (G) Percentage of sequences beginning with the ‘LL’ subsequence (LL − −, ‘−’ denotes either ‘L’ or ‘R’ press in the sequence) or ending with the ‘RR’ subsequence (− − RR) for control (LL − − : main effect of training F4,84 = 18.27, P < 0.0001; − − RR: main effect of training F4,84 = 30.26, P < 0.0001) and striatal NR1-KO mice (LL − − : no effect of training F4,16 = 1.704, P = 0.1982; − − RR: no effect of training F4,16 = 0.6898, P = 0.6096) across training (LL − − : main effect of genotype F1,25 = 11.32, P = 0.0025; − − RR: main effect of genotype F1,25 = 26.93, P < 0.0001). (H) Percentage of sequences containing each appropriate element position for control (L − − − : main effect of training F4,84 = 24.17, P < 0.0001; − L − − : main effect of training F4,84 = 23.88, P < 0.0001; − − R − : main effect of training F4,84 = 29.97, P < 0.0001; − − − R: main effect of training F4,84 = 62.05, P < 0.0001; L − − − vs. − L − − : main effect of element position F1,21 = 9.616, P = 0.0054; first day of significant difference, Day 7, P = 0.0027; − − R − vs. − − − R: main effect of element position F1,21 = 41.56, P < 0.0001; first day of significant difference, Day 1, P = 0.013) and striatal NR1-KO mice (L − − − : no effect of training F4,16 = 1.747, P = 0.189; − L − − : no effect of training F4,16 = 1.077, P = 0.4006; − − R − : no effect of training F4,16 = 0.7249, P = 0.5877; − − − R: no effect of training F4,16 = 1.412, P = 0.275) across training (L − − − : main effect of genotype F1,25 = 22.77, P < 0.0001; − L − − : main effect of genotype F1,25 = 32.21, P < 0.0001; − − R − : main effect of genotype F1,25 = 27.01, P < 0.0001; − − − R: main effect of genotype F1,25 = 60.26, P < 0.0001). Data were analyzed using repeated-measures one-way or two-way ANOVA followed by Tukey or Sidak post-hoc comparisons, respectively. Error bars denote S.E.M., same for below unless stated otherwise. See also Figures S1 and S2.