
Figure 3. Dorsal striatum is necessary for sequence execution, which is distinctly controlled by dSPNs and iSPNs.
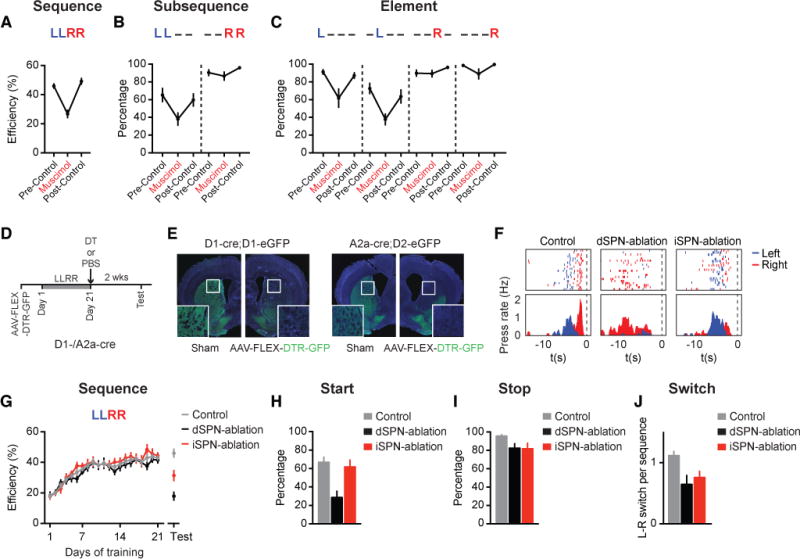
(A) Behavioral efficiency of sequence performance in trained mice during the muscimol infusion day and the pre-/post-control days (n = 7 mice; main effect of treatment F2,12 = 32.44, P < 0.0001; muscimol vs. pre-/post-control, P < 0.0001 and P < 0.0001, respectively). (B) Percentage of sequences beginning with the ‘LL’ subsequence (LL− − : main effect of treatment F2,12 = 7.859, P = 0.0066; muscimol vs. pre-/post-control, P = 0.007 and P = 0.0309, respectively) or ending with the ‘RR’ subsequence (− − RR: no main effect of treatment F2,12 = 2.958, P = 0.0903). (C) Percentage of sequences containing each appropriate element position (L− − − : main effect of treatment F2,12 = 6.604, P = 0.0116; muscimol vs. pre-/post-control, P = 0.0147 and P = 0.0338, respectively; − L − − : main effect of treatment F2,12 = 7.59, P = 0.0074; muscimol vs. pre-/post-control, P = 0.0072 and P = 0.0407, respectively; − − R− : no main effect of treatment F2,12 = 2.138, P = 0.1606; − − − R: no main effect of treatment F2,12 = 3.754, P = 0.0542). (D) Timeline for animal training and DT-mediated dSPN or iSPN ablation. (E) Cell ablation in sham- or AAV-FLEX-DTR-GFP-injected hemispheres following I.P. DT injection in D1-cre;D1-eGFP or A2a-cre;D2-eGFP mice. (F) Example of control, dSPN-ablation, and iSPN-ablation mouse behavior on the day of testing. Data are aligned to magazine entry at time zero. (G) Behavioral efficiency for control (n = 8), dSPN-ablation (n = 7), and iSPN-ablation (n = 8) mice (Test Day: main effect of treatment F2,20 = 22.28, P = 0.0041; Tukey’s multiple comparison test, control vs. dSPN-ablation, P < 0.0001; control vs. iSPN-ablation, P = 0.0051; dSPN-ablation vs. iSPN-ablation, P = 0.0118) (Day 1 control vs. dSPN-ablation, unpaired t-test, t21 = 0.0302, P = 0.9762). (H) Percentage of sequences starting with a left press for control, dSPN-ablation, and iSPN-ablation mice on the day of testing (Main effect of treatment F2,20 = 9.452, P = 0.0013; control vs. dSPN-ablation, P = 0.0018; control vs. iSPN-ablation, P = 0.8483; dSPN-ablation vs. iSPN-ablation, P = 0.0059). (I) Percentage of sequences ending with a right press for control, dSPN-ablation, and iSPN-ablation mice on the day of testing (No main effect of treatment F2,20 = 2.929, P = 0.0766). (J) Averaged number of L-R switches per sequence for control, dSPN-ablation, and iSPN-ablation mice on the day of testing (Main effect of treatment F2,20 = 5.379, P = 0.0135; control vs. dSPN-ablation, P = 0.0057; control vs. iSPN-ablation, P = 0.0241; dSPN-ablation vs. iSPN-ablation, P = 0.4671). Muscimol and ablation data were analyzed using repeated-measures one-way ANOVA and one-way ANOVA, respectively, followed by Tukey’s multiple comparison test. See also Figure S3.