
Figure 5. Optogenetic editing unveils a hierarchical structure of learned action sequences.
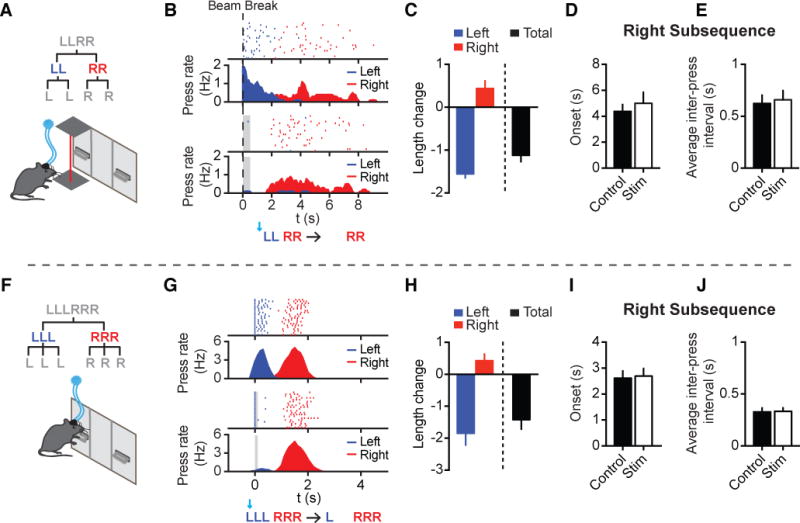
(A) Optogenetic stimulation right before LLRR sequence initiation triggered by infrared beam break (n = 6 mice). (B) Behavioral effect of optogenetic iSPN activation prior to sequence initiation. Lever pressing is aligned to beam break at time zero in both the control (Top Panels) and stimulated (Bottom Panels) conditions. The period of stimulation (500 ms) is covered with gray shadow. (C) Change in the length of the left subsequence (paired t-test, t5 = 16.84, P < 0.0001), right subsequence (paired t-test, t5 = 2.431, P = 0.0593), and the whole sequence (paired t-test, t5 = 7.474, P = 0.0007) between control and stimulated sequences. (D) Averaged time of onset for the right subsequence in the control and stimulated sequences (paired t-test, t5 = 1.365, P = 0.2306). (E) Averaged inter-press interval of the right subsequence in the control and stimulated sequences (paired t-test, t5 = 0.9858, P = 0.3695). (F) Schematic of optogenetic stimulation triggered by the 1st left press of the LLLRRR sequence (n = 12 mice). (G) Behavioral effect of optogenetic iSPN activation following the 1st left press of the LLLRRR sequence in the control (Top Panels) and stimulated (Bottom Panels) conditions. Left and right presses shown as blue and red lines, respectively. The period of stimulation (100 ms) is covered with gray shadow. (H) Change in the length of the left subsequence (paired t-test, t11 = 5.011, P = 0.0004), right subsequence (paired t-test, t11 = 2.069, P = 0.0628), and the whole sequence (paired t-test, t11 = 4.773, P = 0.0006) in the control and stimulated sequences. (I) Averaged time of onset for the right subsequence in control and stimulated sequences (paired t-test, t11 = 0.4149, P = 0.6862). (J) Averaged inter-press interval of the right subsequence in the control and stimulated sequences (paired t-test, t11 = 0.4275, P = 0.6773). See also Figures S5 and S6.