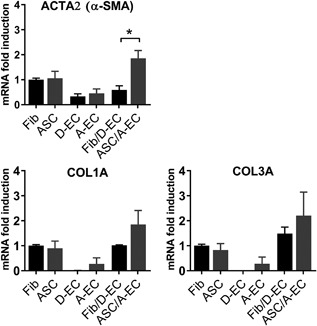
Figure 3.

Expression of fibrosis‐related genes in tissue equivalents. Relative mRNA expression of ACTA2, COL1A, and COL3A by tissue equivalents compared to fibroblasts (Fib). Statistical analysis was performed using a one‐way ANOVA followed by a Kruskal‐Wallis test. *p < 0.05. Data are shown for two donors (D‐EC) or four donors (Fib/EC, ASC/EC, A‐EC) or five donors (Fib, ASC) as mean ± SEM. A‐EC, adipose‐endothelial cells; ASC, adipose‐tissue derived mesenchymal stromal cells; D‐EC, dermal‐endothelial cells; Fib, fibroblasts
