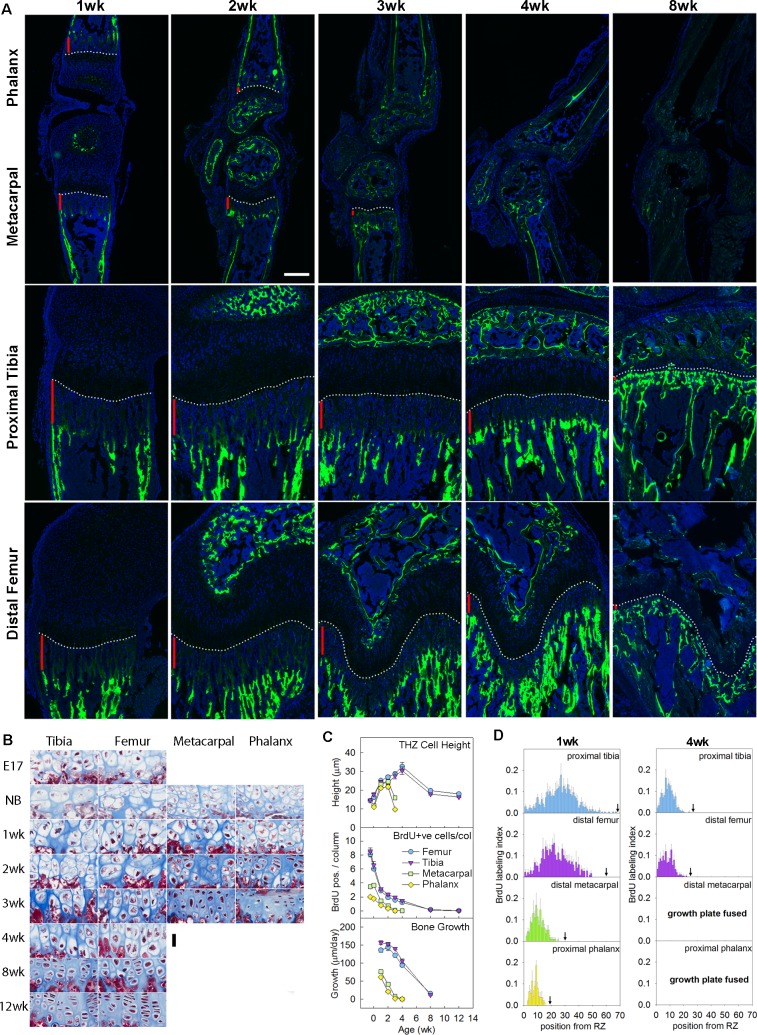
Fig 1. Disparities in chondrocyte proliferation, chondrocyte hypertrophy, and bone growth rate between shorter and longer bones.
(A) Fluorescent images of proximal tibias, distal femurs, distal metacarpals, and proximal forelimb phalanges from mice at various postnatal ages. Rate of longitudinal bone growth was determined from the distance (vertical red bars) between the chondro-osseous junction (white dotted line) and the calcein-labeled (fluorescent green) bone. DAPI was used for counterstain. Scale bar, 200 μm. (B) Masson Trichrome–stained histological sections of hypertrophic zone of proximal tibias, distal femurs, distal metacarpals, and proximal forelimb phalanges, from C57BL/6 mice at E17.5 and various postnatal ages. Hypertrophic cell height diminished earlier in the metacarpals and phalanges. Scale bar, 30 μm. (C) Quantitative histological measurements of TH cell height (upper panel) and number of BrdU-labeled cells per column in the proliferative zone (middle panel), and rate of bone growth measured by calcein-labeling (lower panel). (D) Position-specific BrdU labeling indices of proliferative zone of proximal tibias, distal femurs, distal metacarpals, and proximal forelimb phalanges in 1- and 4-week-old mice. Cell position 1 denotes the proliferative chondrocyte closest to the resting zone, and black arrow indicates the cell position where the proliferative zone ends and the pre-hypertrophic region starts. Position-specific BrdU labeling indices at other time points are depicted in S4 Fig. Raw values for Fig 1C and 1D are available in S1 Data. BrdU, 5-bromo-2-deoxyuridine; E17.5, embryonic day 17.5; TH, terminal hypertrophic.

